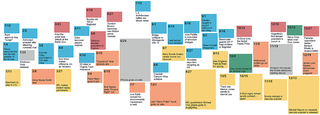
I decided to algorithmically lay out the elements in the AP interactive, 2000-2009: Decade in Review, because of the large amount of content—over 400 events—and very limited amount of time I had to complete the layout.
That large quantity of content also raised usability, visual, and development problems that would need to be solved. The algorithmic approach seemed the most flexible way to address these complexities. The timeline had to:
- Visually show each event, color coded by category (National, Health & Science, etc.).
- Be computed automatically—we added items up to the last minute; manual placement was not a possibility.
- Keep related categories together.
- Keep events in sequential order.
- Make efficient use of space without overwhelming the user with content.
- Be metaphorical: a flowing and undulating river of time.
Visually showing each event with color coding was easy. Making efficient use of space was tougher, so I chose to use a standard force-directed layout algorithm, but with a twist: Instead of using a bounding circle around each node in the graph, I used a bounding box and computed overlap distance between pairs of boxes when relaxing the layout. This yielded a much more efficient “packing” of the items. I first used this technique for the Winter Olympic Medals interactive.
The final algorithm used a few techniques—simulated annealing, force directed graphs, geometric constraints—that took a long time to run until the algorithm converged on a minimal-engery solution. Tweaking the starting parameters yielded different solutions.
To create the final layout, the timeline was computed once, and a data file containing each event’s position was uploaded to the AP servers for the interactive to read.
This sequence of screenshots shows development of the algorithm as it progressed.


