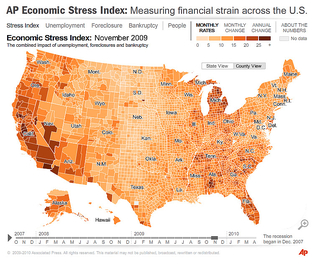
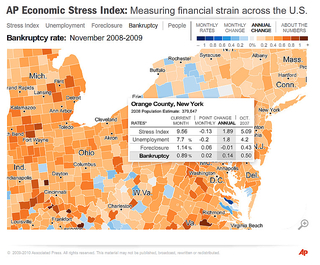
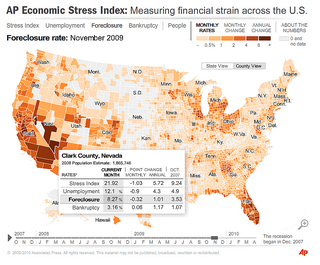
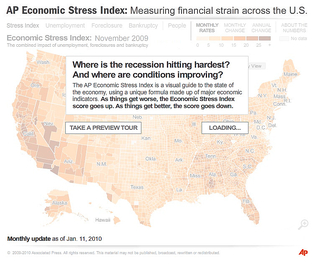
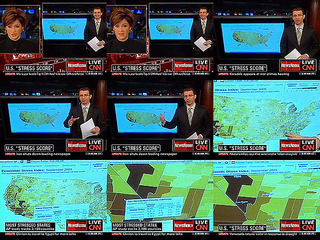
This interactive maps several economic indicators (Unemployment, Foreclosure, Bankruptcy) into a composite index score on both state and county levels. The project was a collaboration across several AP bureaus.
My role in this project involved:
- Building a mapping engine that could load and display spatial data, animate temporal data, and handle user interaction.
- Building a toolchain for converting GIS maps, including a level-of-detail reduction tool.
- Building data pre-processing and database tools to handle the multi-million record bankruptcy database.
- Working with the editorial team to vet the data and the methodology behind the index, including selecting the appropriate data sources for indicators. Example: A county-level dataset was required to represent the recent count of the “number of households” across the US. We only had census estimates for the year 2008, but it occurred to me that we should look at IRS tax filing data which, as it turned out, approximates the number of households.
Other items of note:
- The stress index interactive is updated monthly.
- All maps are animatable from October, 2007 to the present.
- The mapping tools and code have been packaged and re-used across several AP projects.
Awards and distinctions:
- Society of Professional Journalists Sigma Delta Chi Award
- Malofiej Bronze Medal
- SABEW Best in Business Journalism
- Loeb Awards, Finalist
- Deadline Club Awards, Finalist
- Knight-Batten Award for Innovations in Journalism, Notable Entry
- APME Best Use of Multimedia Award
- AP “Beat of the Week” award
- AP Pulitzer Prize nomination

