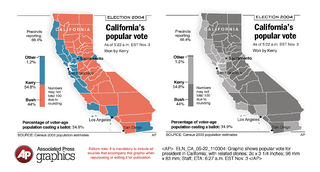
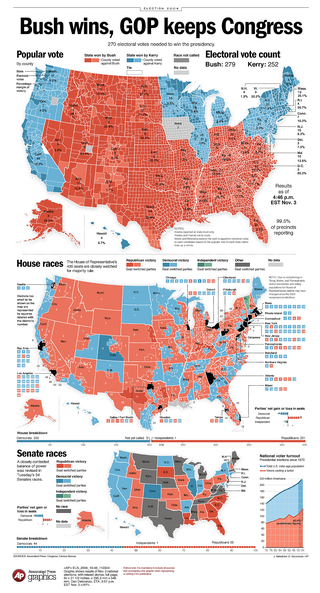
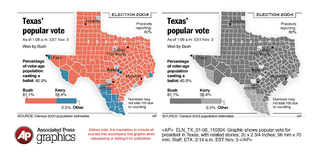
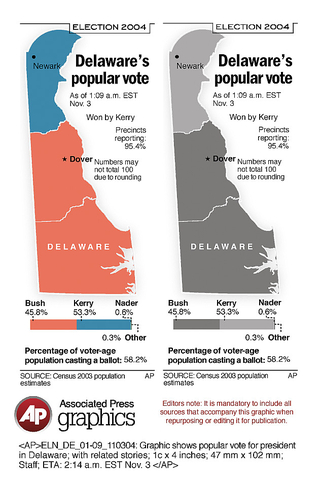
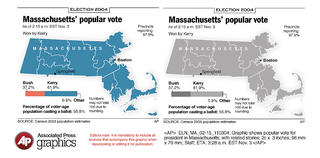
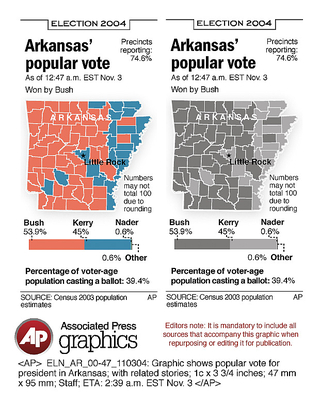
For the 2004 US Democratic primaries and November general election, the AP needed to provide thousands of their member newspapers with print media graphics coverage of national and state results for the presidential, congressional, and senatorial races. AP contracted for my services to come up with a way to quickly and reliably create these graphics based on large data sets.
There wasn’t much off-the-shelf or open source software to generate these types of map graphics in 2004. Flexible formats like SVG weren’t widely supported. Developing an end-to-end solution required a lot of innovating and strategizing. One big challenge was how to geocode maps created by ArcGIS when they were exported to flat vector graphics files.
The solution I came up with was simple and elegant: before exporting the ArcGIS map, I encoded each region’s FIPS code as a 24-bit integer and colorized the region with an equivalent 8-bit RGB value. The software I wrote to colorize the regions with the results then converted the RGB value back to the required FIPS code.
AP Graphics coverage of the election began when the first polls closed on election day, continued as results came in, and ended when all races had been called. Coverage requirements included:
- Maps and data graphics showing which regions voted for which parties or candidates.
- Five large national graphics and 49 state graphics in color and black-and-white versions.
- The largest of the graphics would need to display thousands of datapoints.
- The graphics needed to be generated multiple times as the election quickly unfolded throughout the night.
- All graphics needed to publish with a minimum of prep work by AP staff.
The main elements of the project consisted of the following tasks:
- Creation of software to generate hundreds of election data graphics using AP data.
- Development of a workflow for creating graphics templates.
- Coordination of the software operation on election night.
In the months leading up to election night, I:
- Helped AP Graphics staff determine the content and layout of graphics.
- Provided a template specification for use by AP Graphics staff.
- Reverse-engineered file formats and performed data conversion.
- Gathered and normalized many datasets that would be needed by my software, including thousands of county-level results from the 2000 presidential general election.
- Performed tests to validate the completeness and accuracy of my system.
- Worked with the AP election department to find and fix bugs in the data feeds.
The software I developed did the following on election night:
- Downloaded data feeds via FTP.
- Ingested the results into a SQL database.
- Generated aggregates and high-level data such as margin-of-victory percentages.
- Printed reports for use by AP fact-checkers.
- Developed an XML file format for use in map generation.
- Scripted third-party applications to generate the final maps and graphics.
On election night I provided:
- Training of AP staff in the operation of the software.
- Oversight and coordination of the software operation and workflow
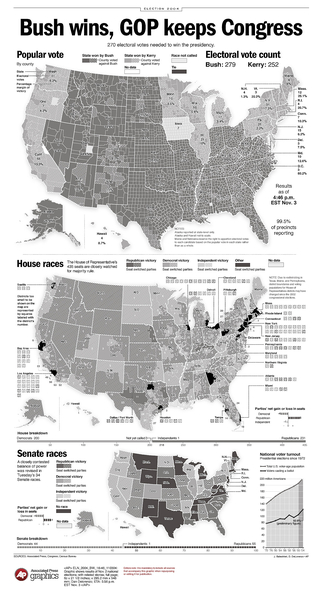
Black -and-white versions of all graphics were created. In black-and-white, patterns substituted for color.
