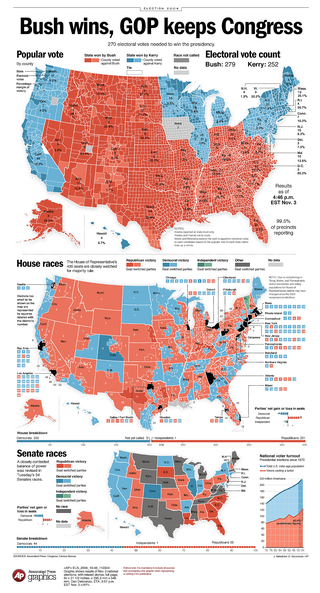
I was the architect and implementor of the entire software system responsible for generating and delivering the AP election maps graphics for print newspapers.
All posts in Elections
2008 Election Graphics Software
2006 Election Graphics Software
I developed software to generate results maps for the 2006 general election. This application was based on work I developed as a consultant in 2004.
The data source for the graphics came from AP election data feeds. Results were captured and loaded into a SQL database where they were retreived and processed by my software.
My software then read in pre-designed page templates and colored the map regions based on the results. The final files were exported in a vector graphics format for AP Graphics staff to finalize page layout and copy editing.
This project’s template-based workflow is based on my SuperGraphics framework. This software allows SVG templates to be read into a DOM, modified, and output in a number of formats. SuperGraphics has advanced text handling features such as font and glyph metrics and word wrap with hyphenation.
2004 Election Graphics Software
For the 2004 US Democratic primaries and November general election, the AP needed to provide thousands of their member newspapers with print media graphics coverage of national and state results for the presidential, congressional, and senatorial races. AP contracted for my services to come up with a way to quickly and reliably create these graphics based on large data sets.


