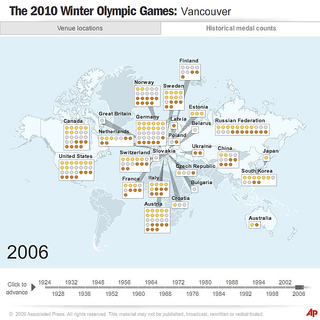
For the AP, I developed this section of a historical overview of the medals won at Winter Olympic Games. The chart components are placed dynamically after the data loads.
A force-directed graph was used to avoid overlapping boxes. Instead of a bounding circle around each node in the graph, I used a bounding box and computed overlap distance between pairs of boxes when relaxing the layout. This yielded a much more efficient “packing” of the items.


