For the AP print and online coverage of data sets tied to US geography, I wrote several tools for working with GIS data. These tools were used to create maps for election and economy coverage.
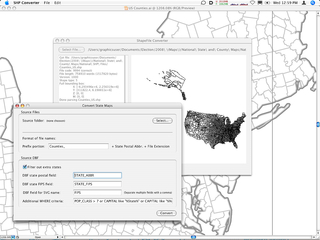
One tool converts ESRI GIS Shapefiles to SVG files. The elements in the exported SVG file are tagged with FIPS values from fields in the Shapefile’s DBF file.
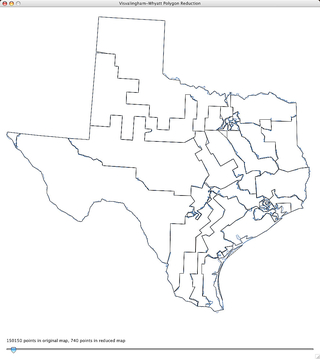
Another tool simplifies geometry. Shapefiles contain too much detail for use in online interactive maps. The tools we had available, ArcGIS polygon reduction and the Simplify command in Adobe Illustrator, were problematic: ArcGIS polygon reduction is limited to grid quantization; Illustrator’s Simplify command uses a simple angle threshold algorithm on the polygon’s outline that is not suitable for creating high-quality geographic imagery.
For high quality simplification, I wrote a tool that reduced the GIS data using the Visvalingham-Whyatt polygon simplification algorithm. This algorithm reduces detail while preserving the polygon’s maximum area.
Finally, I documented an end-to-end workflow for converting Shapefile → SVG → Adobe Illustrator → Adobe Flash, and I developed an ActionScript framework for displaying, navigating, and data populating the maps.


